Logistics parking and urban mobility: understanding to act more effectively.
📅 Tuesday, November 18, 2025 – 2:30 p.m. to 3:15 p.m.
Mayors and Local Authorities Exhibition – Pavilion 4, Carbon-Free Mobility Trail
Paris, France.
Reading time: 1 min
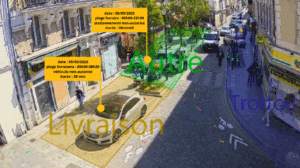
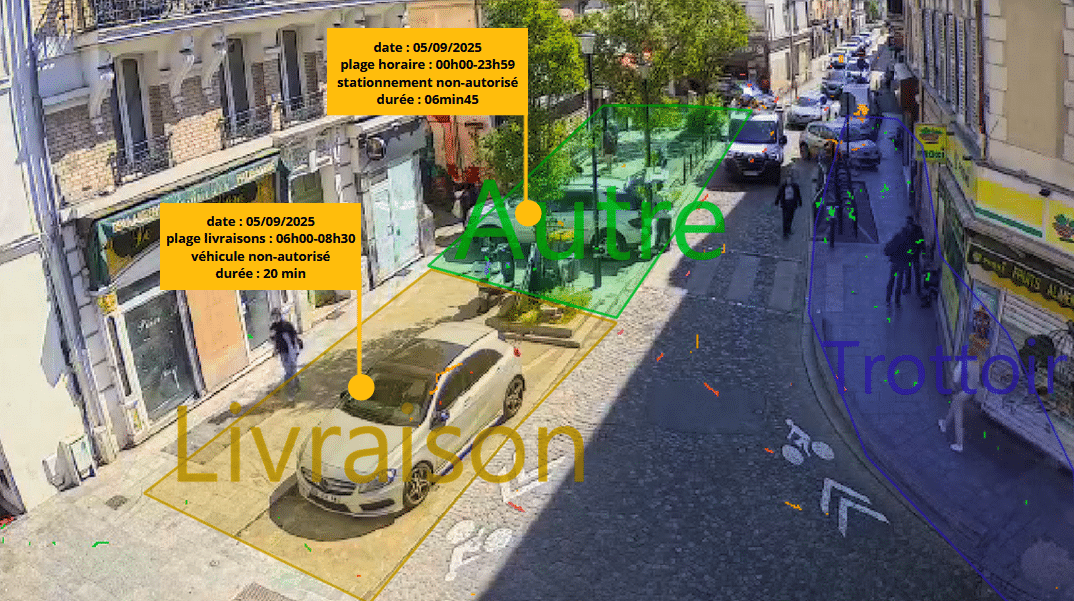
How can we reconcile last-mile deliveries, road sharing, and urban quality of life?
Together with our partners Métropole du Grand Paris, the City of Aubervilliers, and Logicités, we are organizing a four-way conference at the Mayors and Local Authorities Exhibition on the project we are conducting together to rethink logistics parking using data.
🎤With contributions from:
- Jean-Michel Genestier, Logistics Advisor for the Greater Paris Metropolitan Area
- Michel Hadji-Gavril, Third Deputy Mayor of Aubervilliers and Second Vice President of ETP Plaine Commune
- Jérôme Libeskind, Urban Logistics and E-commerce Expert, Logicité
- Sébastien Gomes, Deputy Director, Alyce
Come and attend this practical and inspiring conference for elected officials and mobility stakeholders who want to better understand logistics practices!
Pick up your badge to attend: