

MyGIS
Centralize and analyze all your mobility data in one tool
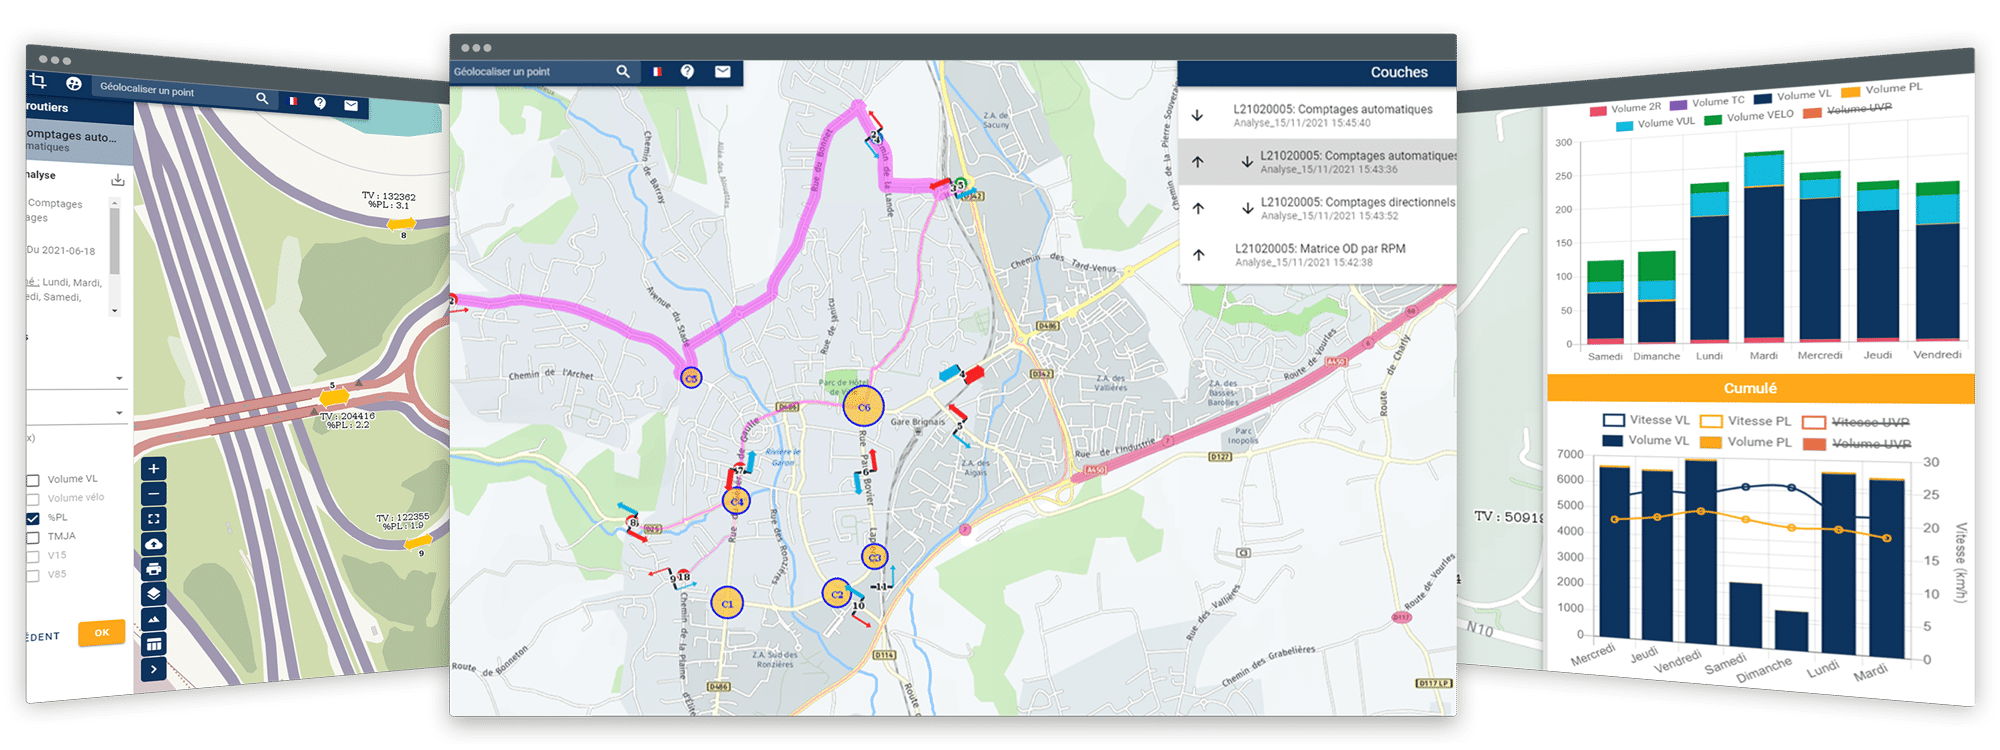
MyGIS is a data visualization platform that aggregates, stores, and facilitates the analysis of mobility data. It provides users with a complete view of mobility data across their territory and allows analysis in just a few clicks, thanks to map-based formatting tools specifically designed to highlight these datasets.
MyGIS integrates a wide variety of data sources: sectional and directional counts, origin-destination surveys, household surveys, public transport passenger counts, and more.
Data Centralization
Aggregates and stores mobility data from all sources in one online platform
SIG Analysis
Data is visualized on base maps, with preconfigured and customizable analyses that can be easily exported in various formats


SaaS GIS Software

Easy to use

Available in multiple languages
Integration of external data

Data sharing

Operational Indicators
- Automatic Counts:
AADT/APDT, peak hours, traffic and flow by vehicle category, average speed, V85 - Directional Counts:
Total or per vehicle category, flow per branch, directional movements - License Plate Surveys:
Volume per station and category, OD flows at point, route mapping - Public Transport Surveys:
Boardings/Alightings per stop
Representations
- Desire lines
- Load curves
- Accessibility calculations
- Isochrone maps
- Traffic snake diagrams
Data Integration
- Traditional surveys and counts: road, PT, EMC2
- Data from new technologies: FCD, GSM
- Socio-demographic data
- Open Data
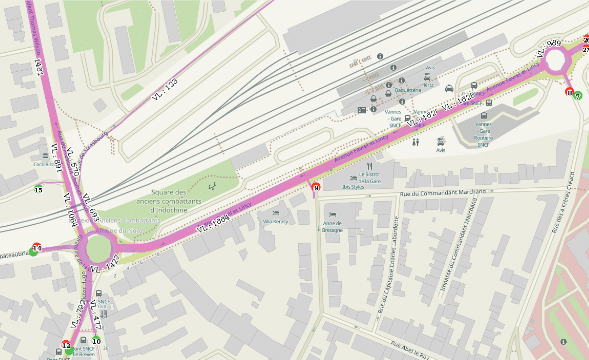
Analyze flows around a multimodal transport hub
With advanced mapping and data processing capabilities, MyGIS makes it possible to visualize user movements, identify congestion zones, and pinpoint strategic intermodal points. By combining geospatial and statistical data, MyGIS helps decision-makers optimize infrastructure planning and improve the user experience.
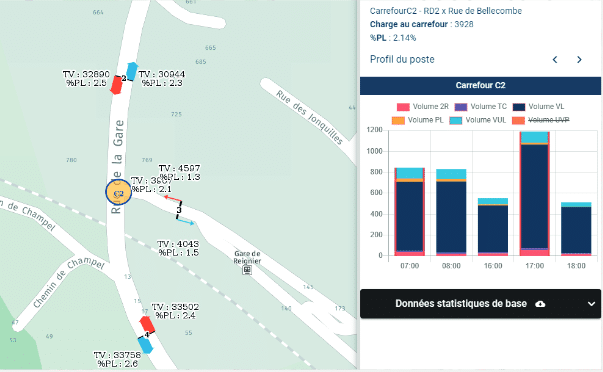
Understand traffic composition around a key corridor
MyGIS breaks down traffic by vehicle types, activity periods, and directional flows. This level of detail provides a clear view of modal share (cars, trucks, bikes, etc.) and helps anticipate infrastructure needs more accurately.

Our team is here for you

Frédéric
Sales Director
With over 25 years of experience in traffic and parking, Frédéric helps mobility professionals implement smart traffic analysis systems. He supports his clients with professionalism and humor to bring their mobility projects to life.