
-

Modelling
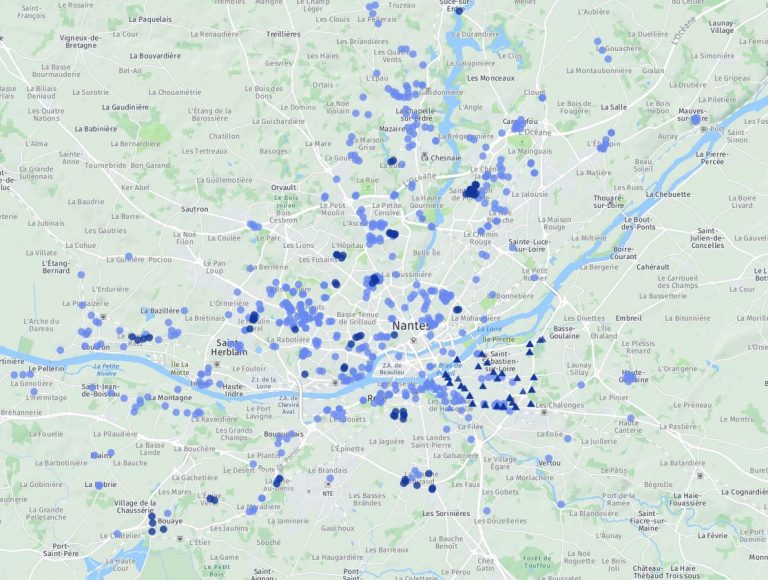
Visual statistics adapted to the representation of mobility data
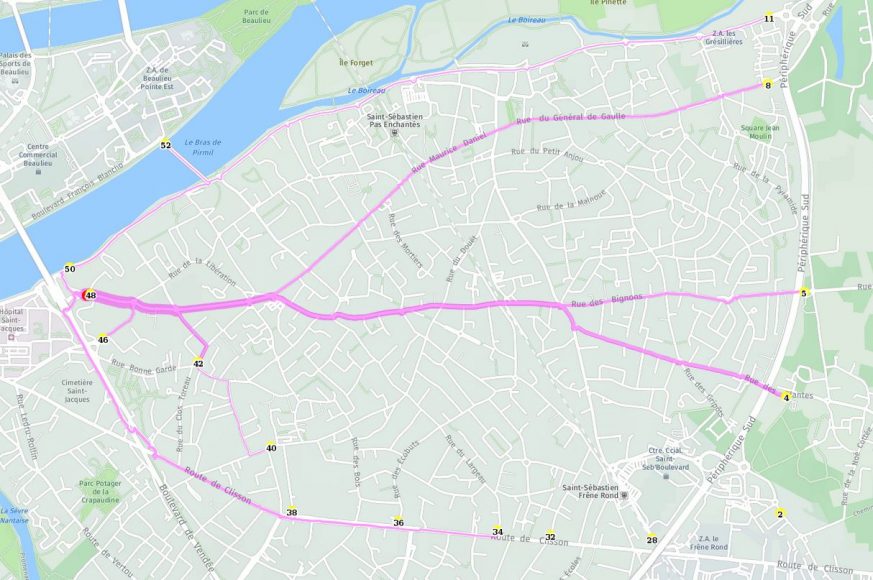
Interactive maps
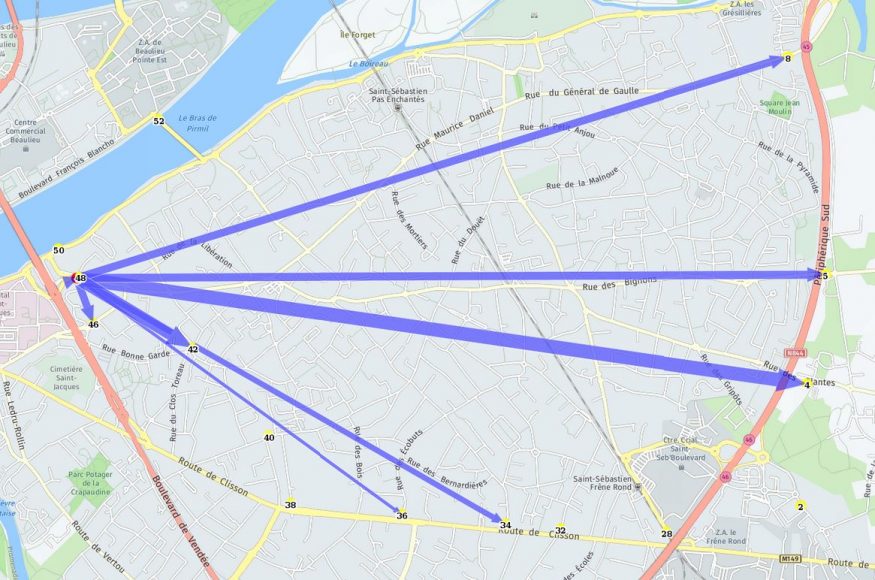
O/D analyses
Accessibility calculations
Isochronous maps -
Centralisation
Aggregated information with multi-source data input.
Traditional surveys and counts: road, public transport, EMC2
NICT data: FCD, GSM
Socio-demographic data
Open Data -
Powerful
Powerful and comprehensive analysis engine.
Ideal for conducting GIS studies with macros, data cross-referencing, advanced mobility and supply-side analysis, display of data from surveys and counts. -
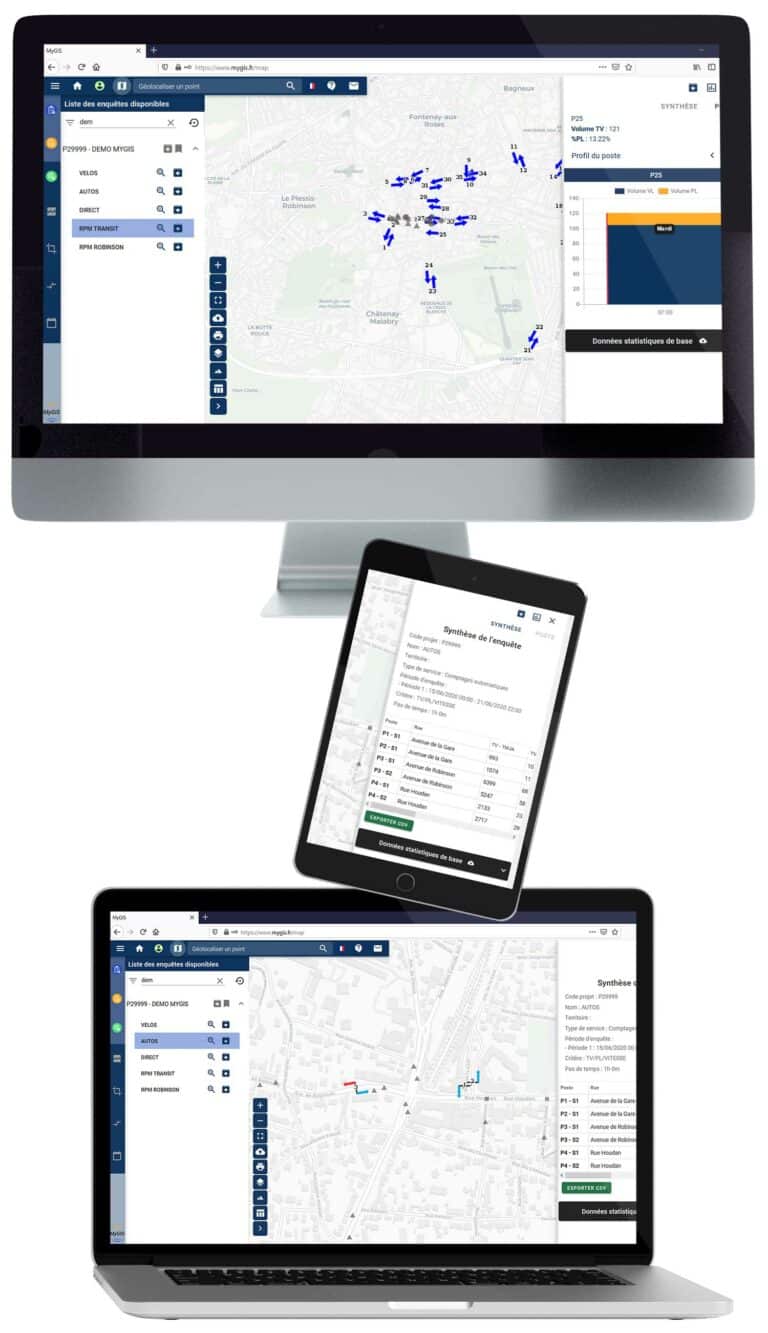
Accessible
Thanks to the SaaS platform model, users can access their data from anywhere and from any type of terminal (computer, tablet, smartphone, etc.).
-
UX Design
The user experience has been designed to be smooth and simple so that anyone can get started quickly.


Julie Vegas
GIS expert